Galaxy Zoo#
Overview#
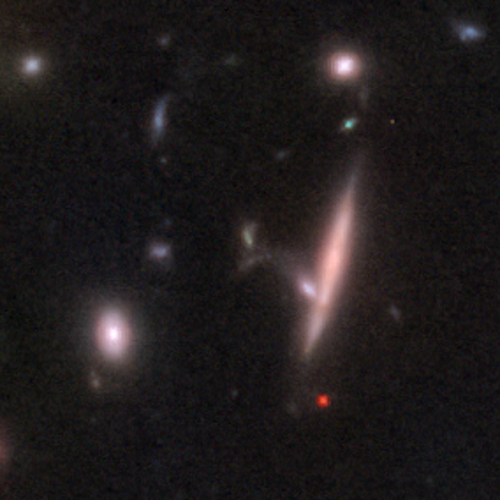
Understanding how and why we are here is one of the fundamental questions for the ages. Part of the answer to this question lies in the origins of galaxies, such as our own Milky Way. Yet questions remain about how the Milky Way (or any of the other ~100 billion galaxies in our Universe) was formed and has evolved. Galaxies come in all shapes, sizes and colors: from beautiful spirals to huge ellipticals. “Kevin Schawinski, previously an astrophysicist at Oxford University and co-founder of Galaxy Zoo, described the problem that led to Galaxy Zoo’s creation when he was set the task of classifying the morphology of more than 900,000 galaxies by eye that had been imaged by the Sloan Digital Sky Survey at the Apache Point Observatory in New Mexico, USA.”
Data Sources#
Original Source
https://www.kaggle.com/competitions/galaxy-zoo-the-galaxy-challenge/data (requires Kaggle account)
File URLs
Questions#
Question 01#
What is the Sky Survey? What motivated scientists to create such a survey?
Question 02#
Galaxy Zoo guides its citizen scientists through a nested decision tree - this is what constitutes the classification process. Why is it important to be able to classify galaxies? Why are the different shapes of galaxies so important? What information is provided from different galaxy colors?
Question 03#
After reading a thorough reading of the paper in [1], describe what constitutes the decision tree. What are the conditions described in the decision tree?
Question 04#
Download file central_pixel_benchmark.zip from either of the data source locations above.
The header of the Benchmark data looks something like this:
GalaxyID,
Class1.1, Class1.2, Class1.3,
Class2.1, Class2.2,
Class3.1, Class3.2,
Class4.1, Class4.2,
Class5.1, Class5.2, Class5.3, Class5.4,
Class6.1, Class6.2,
Class7.1, Class7.2, Class7.3,
Class8.1, Class8.2, Class8.3, Class8.4, Class8.5, Class8.6, Class8.7,
Class9.1, Class9.2, Class9.3,
Class10.1, Class10.2, Class10.3,
Class11.1, Class11.2, Class11.3, Class11.4, Class11.5, Class11.6
Label each class number with each corresponding decision tree conditions.
Question 05#
Sample data would look something like the following:
100018,
0.468481225, 0.506184901, 0.025333873,
0.099843579, 0.406341321,
0.095166943, 0.311174378,
0.185079516, 0.221261805,
0.019014618, 0.157050124, 0.194385937, 0.035890642,
0.214294993, 0.785705007,
0.195926631, 0.221751402, 0.050803194,
0.038988255, 0.014478764, 0.027519262, 0.023837245, 0.063030884, 0.043247289, 0.003193269,
0.066031673, 0.010392192, 0.023419713,
0.082313979, 0.07125346, 0.031512075,
0.012281073, 0.079963984, 0.01434553, 0.006368535, 0.006648832, 0
The first one is the GalaxyID and the following are the probabilities of each node. Can you tell what is the most likely (highest likelihood) Class for this galaxy?
Question 06#
Draw the classification distribution histogram. Can you tell which type of Galaxy is the majority distribution?
References#
[1] K.W. Willet, et.al, “Galaxy Zoo 2: detailed morphological classifications for 304,122 galaxies from the Sloan Digital Sky Survey”, Mon.Not.Roy.Astron.Soc. 435 (2013) 2835, e-Print: 1308.3496 [astro-ph.CO]
Acknowledgements#
Initial version: Mark Neubauer
© Copyright 2023